Conductivity Claims vs. Reality: What Your Thermal Paste Spec Sheet Isn't Telling You
Every IT professional responsible for server hardware has, at some point, selected a thermal interface material based on its advertised thermal conductivity rating. That number — expressed in watts per meter-kelvin (W/m·K) — sits prominently on product pages, data sheets, and procurement catalogs. It looks authoritative. It feels measurable. And in a meaningful number of real-world deployments, it is quietly misleading your infrastructure decisions.
This is not an accusation of deliberate fraud. The mechanics of how thermal conductivity ratings are derived, combined with the realities of how thermal paste behaves over time in production environments, create a structural gap between laboratory specification and field performance. For IT teams managing dozens or hundreds of servers, that gap has a dollar value — and it is larger than most organizations realize.
How Thermal Conductivity Ratings Are Measured — and Why That Matters
Manufacturers typically measure thermal conductivity using standardized laboratory methods, most commonly ASTM D5470 or comparable transient hot-wire techniques. These tests are conducted under controlled conditions: uniform application thickness, consistent clamping pressure, stable ambient temperature, and freshly prepared compound. The result is a clean, reproducible number.
Production environments are none of those things.
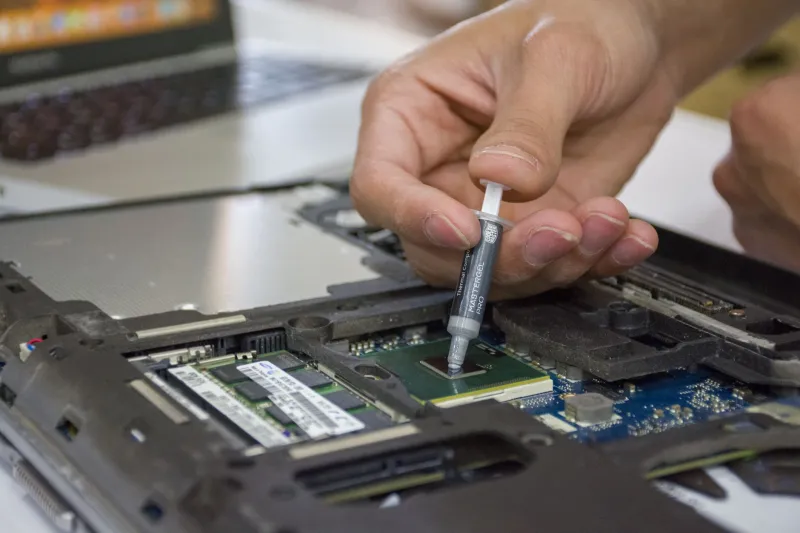
Server boards introduce variable surface finishes across IHS (integrated heat spreader) and heatsink contact plates. Technician application technique varies — some apply a pea-sized dot, others spread manually, and a meaningful percentage apply too much or too little compound relative to the optimal bond line thickness for a given compound's viscosity. Clamping pressure from retention mechanisms differs between heatsink generations and chassis configurations. None of these variables appear on the spec sheet, yet each one materially affects the effective thermal resistance at the junction.
The practical consequence is that a compound rated at 12 W/m·K in a laboratory may perform comparably to a 7 W/m·K product in a specific server configuration — or it may outperform it. The rating alone does not tell you which outcome to expect.
Viscosity Drift: The Long-Term Performance Variable Nobody Tracks
Perhaps the most underappreciated factor in enterprise thermal paste selection is viscosity drift — the change in a compound's physical consistency over operational time and temperature cycling. Most IT teams apply thermal paste during initial hardware deployment and revisit it only during major component replacements, often years later.
During that interval, thermal compounds undergo measurable physical changes. Polymer-based carriers can outgas volatile components, causing the compound to stiffen and lose the conformability that allowed it to fill microscopic surface irregularities at installation. Metal-particle compounds, particularly those using silver or aluminum particulates, can experience particle migration and settling under sustained thermal gradients, creating regions of uneven conductivity across the contact surface.
The result is a compound that was performing adequately at month three of deployment and is performing noticeably worse by month eighteen — without triggering any obvious alert in your monitoring stack. CPU junction temperatures climb gradually. Thermal throttling events become slightly more frequent. Cooling fans ramp earlier and stay elevated longer. Each symptom is individually easy to attribute to workload changes or ambient conditions. Collectively, they represent compound degradation that a simple reapplication would address.
Without a systematic reapplication schedule — something remarkably few enterprise IT policies include — this degradation accumulates silently across a server fleet.
Application Pressure and Bond Line Thickness: The Variables Your Procurement Process Ignores
Different heatsink retention systems apply different clamping forces to the CPU package. Backplate-and-spring designs common in rack-mount servers can vary by several pounds of force depending on spring fatigue over time and installation torque consistency. This variation directly affects bond line thickness — the actual depth of the thermal compound layer between heat spreader and heatsink base.
Thinner bond lines generally improve thermal performance for high-conductivity compounds, but only up to a point. Compounds with lower viscosity flow more readily under pressure, achieving thinner and more uniform bond lines. Higher-viscosity compounds — often those with the most impressive conductivity ratings — may resist complete spreading under standard clamping forces, leaving a thicker, less uniform layer that partially negates their conductivity advantage.
This is a critical procurement blind spot. IT teams selecting compounds based solely on conductivity ratings may be choosing products that their specific heatsink retention hardware cannot apply optimally. The compound with the lower rating and the lower viscosity may consistently deliver better junction temperatures in that specific deployment context.
Building a Procurement Standard That Reflects Actual Performance
Addressing this gap requires moving thermal paste procurement from a spec-sheet exercise to an empirical one. The following framework gives IT teams a practical starting point.
Establish a controlled baseline test environment. Designate one or two representative server configurations from your fleet and acquire a consistent thermal load generator — stress-testing utilities like Prime95 or vendor-provided burn-in tools work adequately for comparative purposes. Run identical workloads across candidate compounds, measuring CPU package temperatures and fan RPM deltas rather than relying on compound ratings.
Test at installation and at a defined interval. Apply each candidate compound to identical hardware, record baseline temperatures, then retest the same units after 90 days of production-equivalent thermal cycling. The delta between initial and post-cycling performance is your viscosity drift indicator. Compounds that degrade significantly in 90 days will perform worse at 18 months.
Standardize application method and quantity. Eliminate technician variability by defining a specific application protocol — volume, pattern, and spreading method — for each heatsink form factor in your environment. Pair this with torque-controlled fastener installation where hardware permits. Consistency in application is often more impactful than compound selection.
Incorporate reapplication intervals into maintenance schedules. Based on your drift testing data, establish a maximum service interval for thermal compound in production servers. For most enterprise environments, a 24-to-36-month reapplication cycle is a reasonable starting point, though high-density compute nodes running sustained workloads may warrant shorter intervals.
Document junction temperature trends in your monitoring platform. Configure alerts not just for threshold breaches but for gradual trend lines. A CPU package temperature that rises 3°C over six months under identical workload conditions is a compound degradation signal, not a workload signal.
The Capital Expenditure Connection
This is ultimately a budget conversation as much as a hardware one. Cooling infrastructure upgrades are among the more expensive line items in a data center refresh cycle. When IT teams observe rising thermal metrics across aging server populations, the instinctive response is often to evaluate supplemental cooling capacity — additional CRAC units, in-row cooling additions, or accelerated hardware refresh timelines.
In a meaningful subset of those cases, the underlying cause is compound degradation rather than insufficient cooling infrastructure. A fleet-wide reapplication program, executed by internal staff or a contracted hardware maintenance vendor, costs a fraction of a cooling infrastructure expansion. The diagnostic discipline to distinguish between the two scenarios is what most IT organizations currently lack.
Building that discipline starts with treating thermal interface material as a managed consumable with a defined service life — not a one-time installation detail that disappears into the background after initial deployment.
The spec sheet number is a starting point for comparison, not a performance guarantee. The IT teams that understand that distinction are the ones making cooling infrastructure decisions based on actual thermal data rather than compound marketing copy.